Chapter 21 Using the Assembler, QEMU, & GDB
Before we get started on assembling and running your first Program, we need some software that will emulate programs written in ARMv8, and will give us debugging capabilities (to remedy errors, crashes, etc). QEMU is software that is capable of running different Architectures. The GNU Debuggger (GDB) is capable of debugging programs that are running via QEMU.
I do not own a Windows Machine, so all of these installation and setup guides are for Linux only. You should already have the GNU Assembler installed from Chapter 5.
Install QEMU and the GNU Debugger (GDB):
sudo apt-get update
sudo apt-get install qemu-user qemu-user-static gdb-multiarch build-essential
There are two different types of Source Files that the Assembler can understand....
example.s is a pure/raw/bare-bones Assembly Source File. In nooby terms, when the Assembler generates these raw files into an Executable, the Assembler will only add in what are known as "Elf" attributes and nothing else. These Elf Attributes are required so the Computer will know it's an Executable file. There is no extra instructions/code that will be added to the final executable file.
example.S, in nooby terms, this is an Assembly Source File that is meant to run alongside a C/C++ file. Essentially the C/C++ file is the "main source". It will contain subroutines (known as function calls) that it will use. Some of these function calls/subroutines will be located in various .S files due to being handwritten in Assembly.
.S files do not need to have a C/C++ file as the "main source". The. S file itself can be the main source and have the ability to include what is known as C/C++ standard libraries. These libraries are a variety of useful functions that we can use. There is no need to write out monstrous amount of Assembly Code for certain tasks. If it exists as an included library, we can simply call it (more on function calls in Chapter 26).
.s (raw/barebones) files *can* include C/C++ files (which allows library inclusion as well), but that requires more complexity and extra files (i.e. Makefile). This won't be covered at all in any Chapter.
To write a barebones Assembly Source File, it needs to start with the following....
.section .text
.global _start
_start:
NOTE: Your Assembler Directives (for items such as Symbols, Macros, etc) are placed above ".section .text". They should be the very first items present in your Source File.
The "_start" must include the preceding underscore. Without going into technical details, the first line (.section .text) simply establishes that the file will be of executable instructions.
The 2nd line makes "_start" visible to what is called the Linker. We don't need to worry about the technical side of this, just understand that it's needed. Alternatively, you can use .globl instead of .global.
The 3rd line is simply a label that points to the very start of the program. This label must be "_start:". Do *NOT* use "_start" for any other label(s) in your Source.
Underneath "_start:" is where you would start writing out your ARM64 Code. Alrighty. moving on...
Create the following hello_world.s file....
.section .text
.global _start
_start:
// syscall write(int fd, const void *buf, size_t count)
mov x0, #1
adr x1, msg
mov x2, len
mov w8, #64 /*Syscall number for write for ARM64*/
svc #0
// syscall exit(int status)
mov x0, #0
mov w8, #93 /*Syscall number for exit for ARM64*/
svc #0
msg:
.asciz "Hello World!\n"
len = . - msg
Let's unpack some things from the above file. QEMU emulates what is called syscalls. These syscalls are meant to mimic a Computer BIOS that has built in functions for basic tasks. You've learned about the svc instruction briefly back in Chapter 18. In real hardware, the svc instruction will go to an exception handler routine. At this routine, there is code (already written by the program earlier) to handle the use of svc.
With QEMU, this is totally different. It doesn't matter what is written at the exception handler routine by your Program. QEMU will execute the svc to emulate a Computer BIOS that has already written certain instructions at the exception handler. In a nutshell, the routine there is universal among Computer BIOS's. Thus, the routine accepts certain arguments to produce a result. You can tell this is the case because in the above file, we have no code that has written any instructions to any exception handler. What sucks about the emulated syscalls is that we can't actually see & debug a svc exception. The good thing is, we can use these emulator syscalls for basic tasks. Like printing text to the console (terminal), modifying files, etc.
Syscall Write prints a message on the console (terminal). Syscall Exit exits the program.
There are many Syscalls and each Syscall requires argument(s). The correct values must be placed in the correct registers before the syscall is "called" (via the svc instruction). This concept of having the right arguments in the right registers is known as the Calling Convention of ARM64. This concept is covered in Chapters 26 and 27.
Anyway let's get back to unpacking the code in the Source File...
To run our Program, we need to Assemble it to an object file. And then use the Linker to make an executable file that can be used. That can be done with the following two terminal commands..
aarch64-linux-gnu-as -mcpu=cortex-a57 hello_world.s -o hello_world.o
aarch64-linux-gnu-ld hello_world.o -o hello_world
In the first command we specify the Cortex-A57. We do because in the future Chapters (such as Cache), information that we will learn will be Cortex-A57 specific.
So we now have an executable file. We can launch it with QEMU...
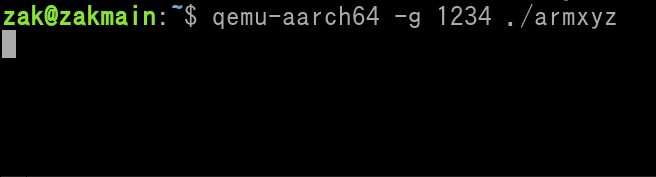
qemu-aarch64 -g 1234 ./hello_world
You will see that nothing happens when you enter in this command. It will stall.
QEMU is waiting on the GNU Debugger (GDB) to be launched. In a second terminal (while keeping the QEMU terminal running), run this command...
gdb-multiarch -q --nh \
-ex 'set architecture aarch64' \
-ex 'file hello_world' \
-ex 'target remote localhost:1234' \
-ex 'layout split' \
-ex 'layout regs'
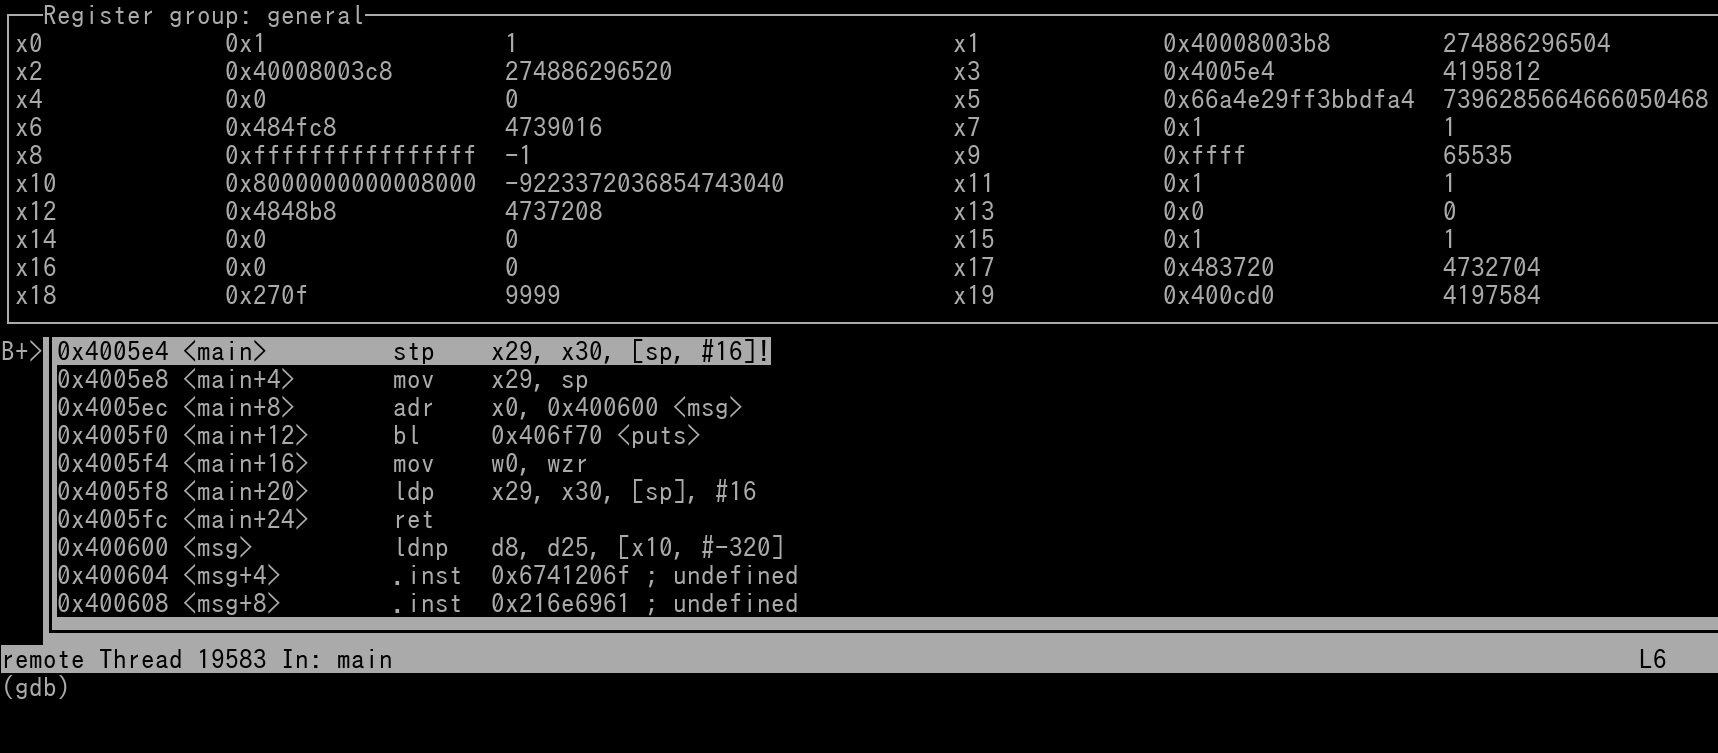
Once, you've entered the above terminal command, you will be at the first instruction of the Source File (mov x0, #1).
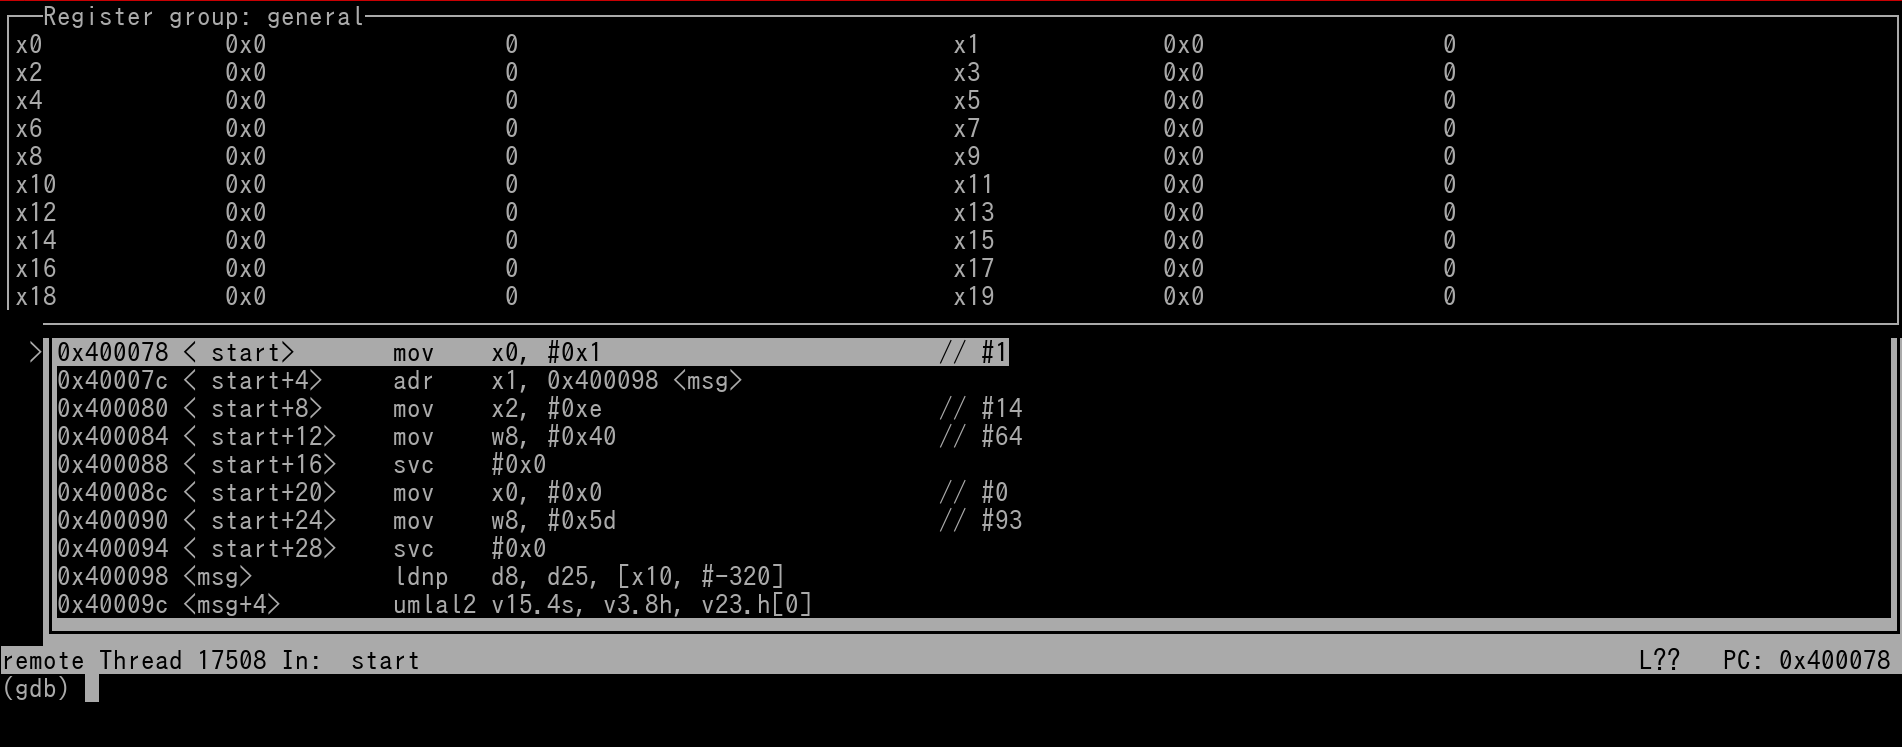
GDB may say that the Registers are unavailable. I have no idea why this occurs as it should be available once GDB has launched.
Before continuing let's cover some basic GDB Specific Commands~
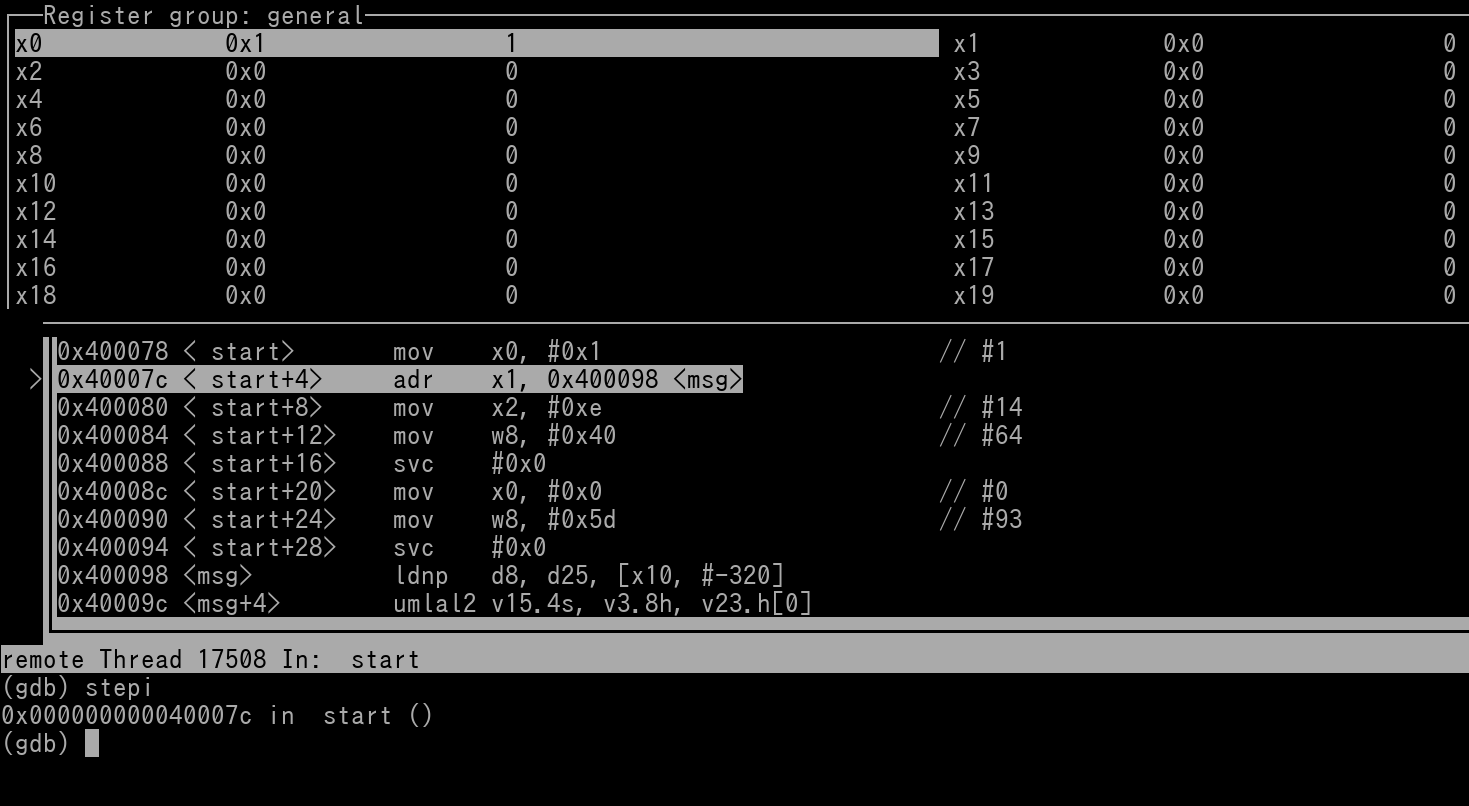
stepi will be the most common GDB command that you will use. It will force QEMU to execute the program one instruction at a time. This is known as "stepping". Stepping is the best way to understand how certain instructions work. It's great for beginners.
Go ahead and do one stepi command. If the registers were not available, they will now be available. You will see that x0 now equals 1, due to the mov instruction.
NOTE: If registers were unavailable upon boot of GDB, we can remedy this by simply having the Source File start with a nop. That way, the first relevant instruction to your Source can be stepped and examined.
Continue to step thru the Program. By the way, you do not have to type stepi again and again. If your next GDB command is the same as the previously entered GDB command, you can simply press Enter on your keyboard.
IMPORTANT: When stepping thru the svc instructions, you will not be able to step thru the exception routine itself, because it's emulated (fake). Once you perform a stepi command on svc, the syscall is emulated, and you will be 2 instructions ahead (first instruction present after the svc gets auto-stepped).
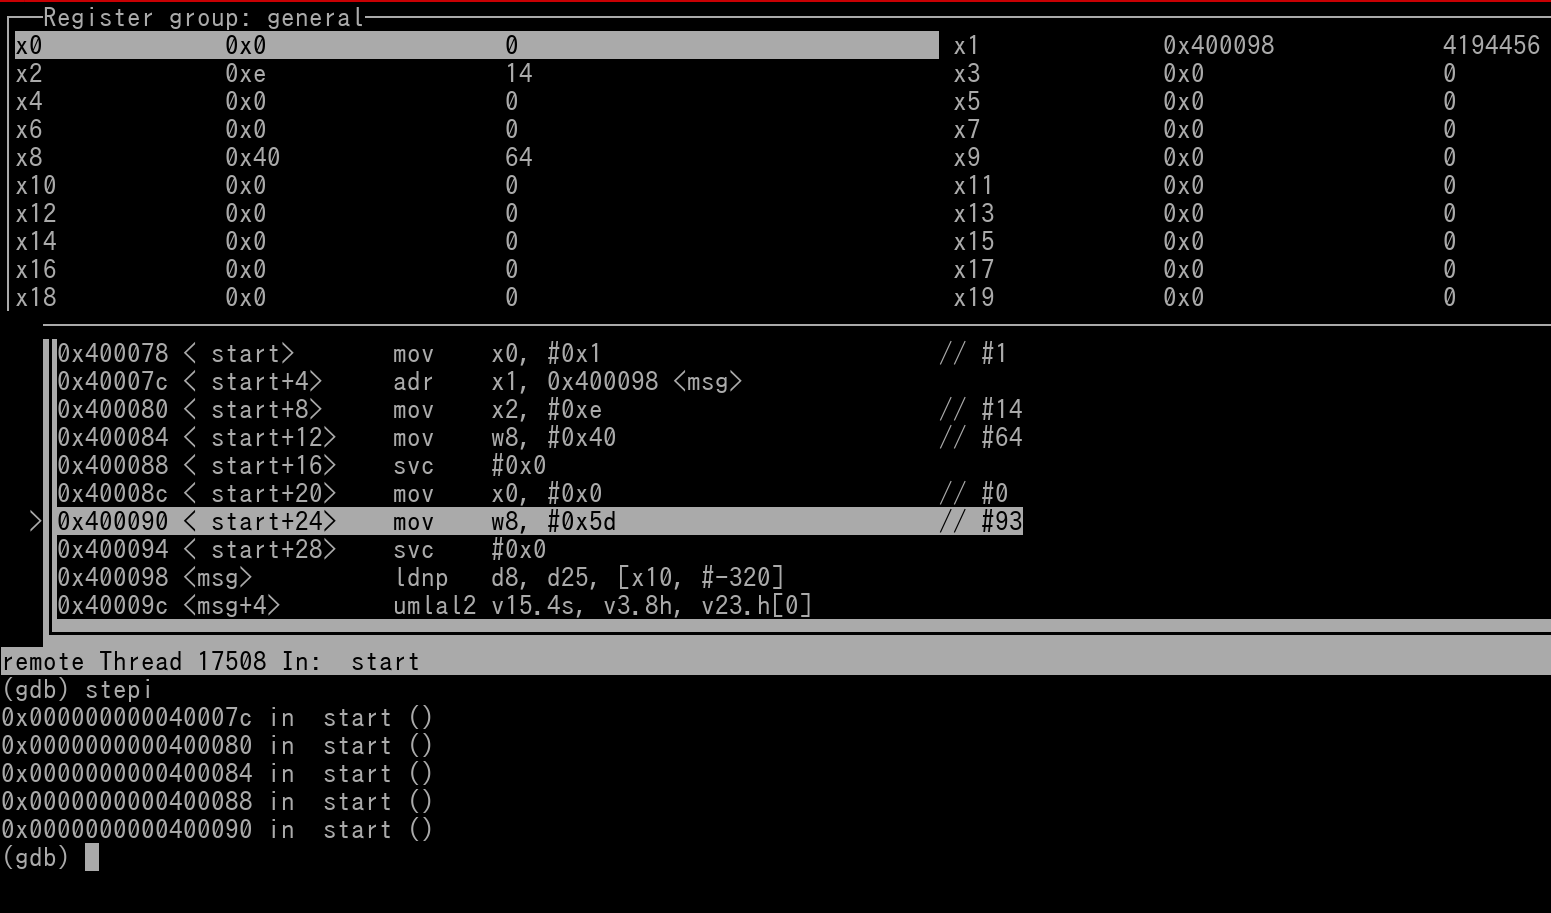
So here is a pic of right before stepping through the first svc (syscall) instruction
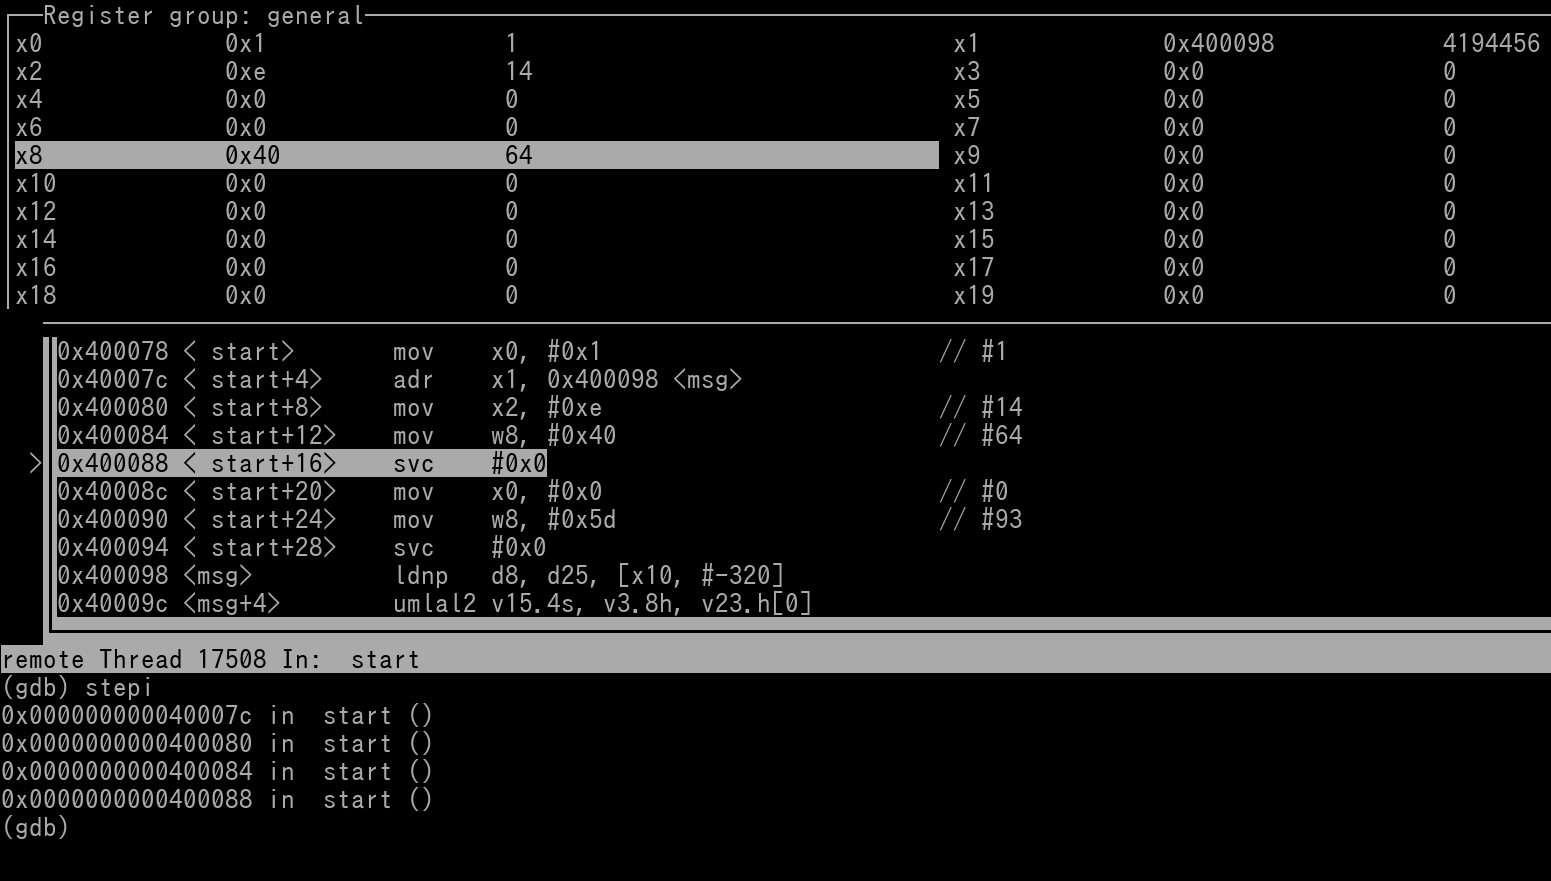
The very moment you have stepped past the first syscall you be be navigated to the "mov w8, #93' instruction. Thus you weren't allowed to step through the first instruction immediately after the syscall.
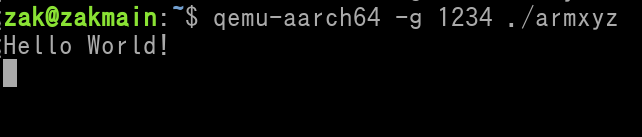
Take a look your terminal that is running QEMU. You will see that it says "Hello World!"
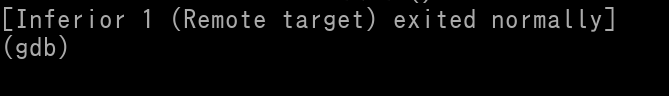
Once you stepped past the 2nd syscall, you be notified by GDB that the Program has been terminated (due to syscall exit)
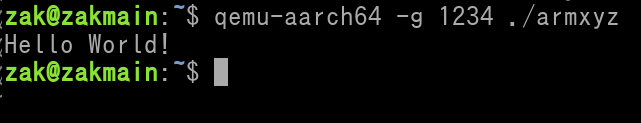
Take a look at the QEMU terminal again. You will see the terminal process has been terminated. This is because of the exit initiated by the 2nd syscall.
Once you have stepped past the 2nd syscall, you can close down GDB using the quit command.
Exception Level Notes:
Because the Source File is barebones, there was no previous code that was completed beforehand. This means that the File is being executed in EL3 mode. You have full read/write access to literally everything.
Instead of using .s files (barebones), let's focus on .S files. This will allow us to use standard C/C++ library functions such as printf, puts, sprintf, sscanf, fopen, fwrite, etc. You can find information about these functions all over the web. Once you have learn about functions in Chapter 26, you will be able to know how to write your Program to use these functions to do complex tasks.
Create a file called hello_again.S. It will begin with the following contents...
// Any symbols, macros, etc go at the very top
.section .text
.global main
main:
As you can see. it's similar to the barebones file, but the label _start is replaced with main. You must use the label name main. Do not use main for any other label(s).
Underneath "main:" will be your ARM64 Code. For demonstration, this will be our entire hello_again.S file..
.section .text
.global main
main:
// Call puts and return
stp fp, lr, [sp, #0x10]!
mov fp, sp
adr x0, msg
bl puts
mov w0, wzr
ldp fp, lr, [sp], #0x10
ret
msg:
.asciz "Hello Again!"
.align 2
Things to unpack from the Source File:
The first 2 instructions is for what is called the Prologue. This is covered later in Chapters 26 and 27. Basically the SP register is adjusted so that data can be saved for when the puts function is used, and in the case of possible interrupts.
The adr instruction sets x0 to have the Memory Address of where the string is located.
'bl puts' calls the puts function. It's a C library function that will output text to the console/terminal. Alternatively, one could use printf instead. Printf is far more common and known. Puts is used instead as it is faster for the CPU since it cannot accept what is called format descriptors in the string. Also the puts function automatically enters into a new line on the console. Notice how we did not have the "\n" included in the Hello Again string.
The 'mov w0, wzr' instruction is to give the CPU a zero value that it will use when it exits the program.
Recall earlier that in hello_world.s barebones file, we used a syscall-exit to exit the program. Syscall-exit requires a "status number", which is 0 for "success". This is why w0 is set to 0. Later on, the CPU will call the C/C++ exit function to exit the program.
The last two instructions is for what is called the Epilogue. Essentially the opposite of a Prologue. This is covered later in Chapters 26 and 27.
Whenever you write any .S (main:) type of Source File, a final ret instruction will have the CPU end the Program and call the C/C++ Exit function. w0 should always be set to 0 before the ret instruction.
When ready to Assemble, it's a bit different. The terminal command for Assembling the file is this....
aarch64-linux-gnu-gcc -Wa,-mcpu=cortex-a57 -ggdb3 -o hello_again -static hello_again.S
As you can see we don't need 2 terminal commands when we had to Assemble hello_world.s. Once you have the file assembled, launch it on QEMU.
qemu-aarch64 -g 1234 ./hello_again
Now when it comes to the terminal command to bring up GDB, we need to include an extra GDB command
gdb-multiarch -q --nh \
-ex 'set architecture aarch64' \
-ex 'file hello_again' \
-ex 'target remote localhost:1234' \
-ex 'break main' \
-ex continue \
-ex 'layout split' \
-ex 'layout regs'
The "-ex 'break main' \" GDB command will force GDB to setup the hello_again executable to run until it hits the "main" function, which is the start of our Source File.
Now let's say you are stepping and you want to execute the puts function. Obviously this is a library function so it is EXTREMELY LONG. It will literally take you days to step the entire puts function. What we can do to get around this is apply Breakpoints on Memory Addresses. Take a look at the following pic...
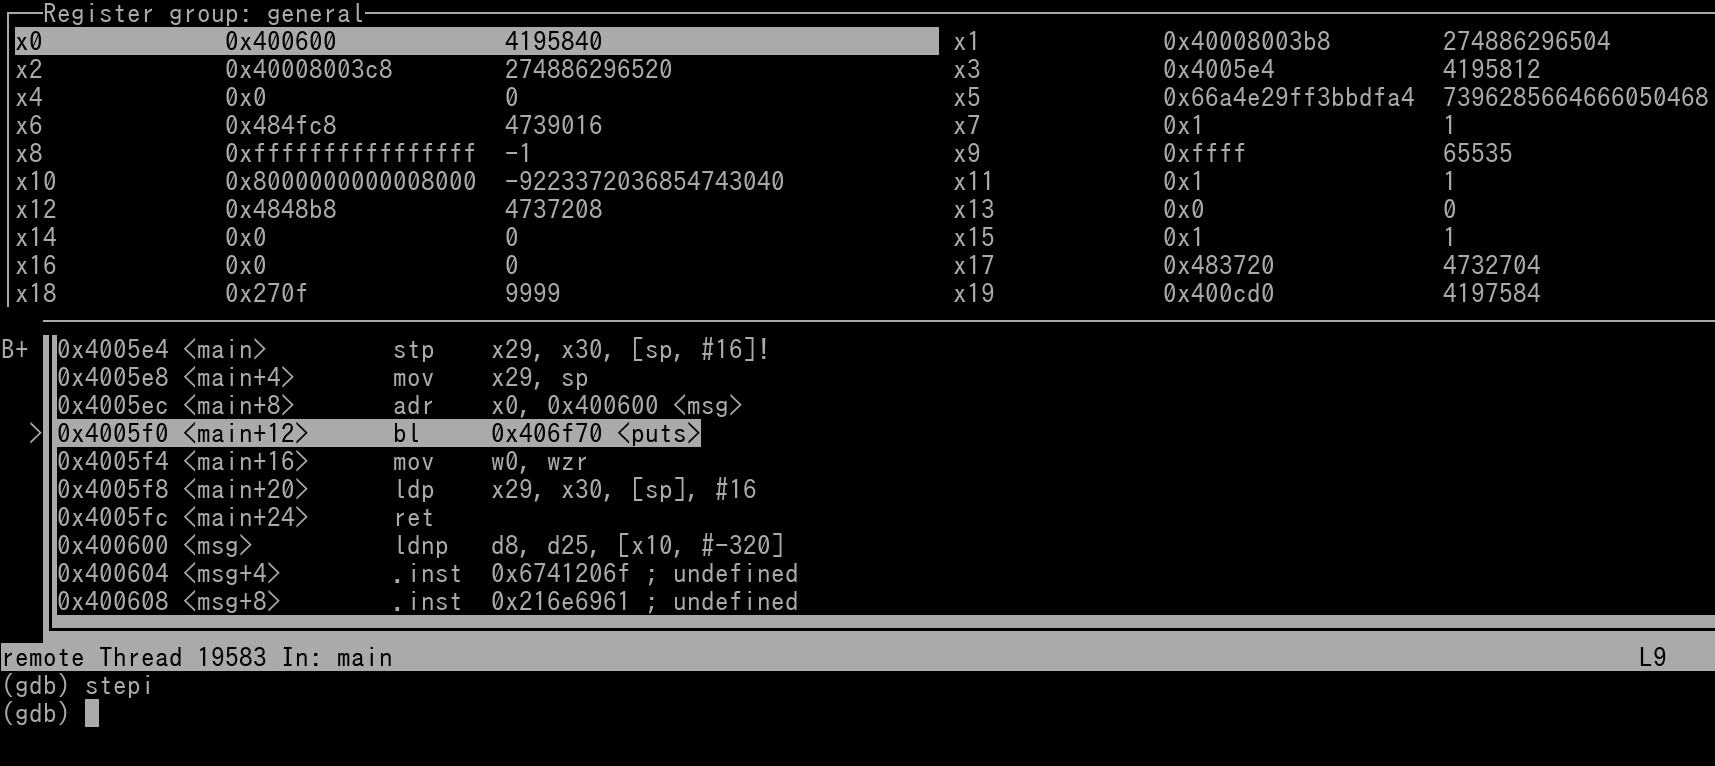
We can see the next instruction to be stepped is the "bl puts" instruction. We see the instruction underneath is the mov instruction. You will notice that to the left of each instruction is the Memory Address that the instruction is residing at. What you can do is set a Breakpoint on the Address of the mov instruction.
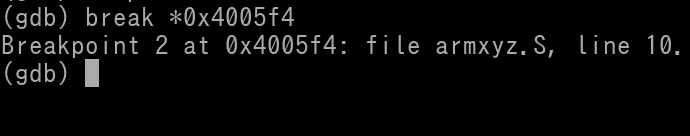
break *0x4005f4
An asterisk must prepend the Memory Address. Type the above GDB command and press enter. The new breakpoint will be set.
Now all you need to do is issue a step command (**NOT** stepi). This will allow the program to run until it hits your breakpoint thus executing the puts function in real time.
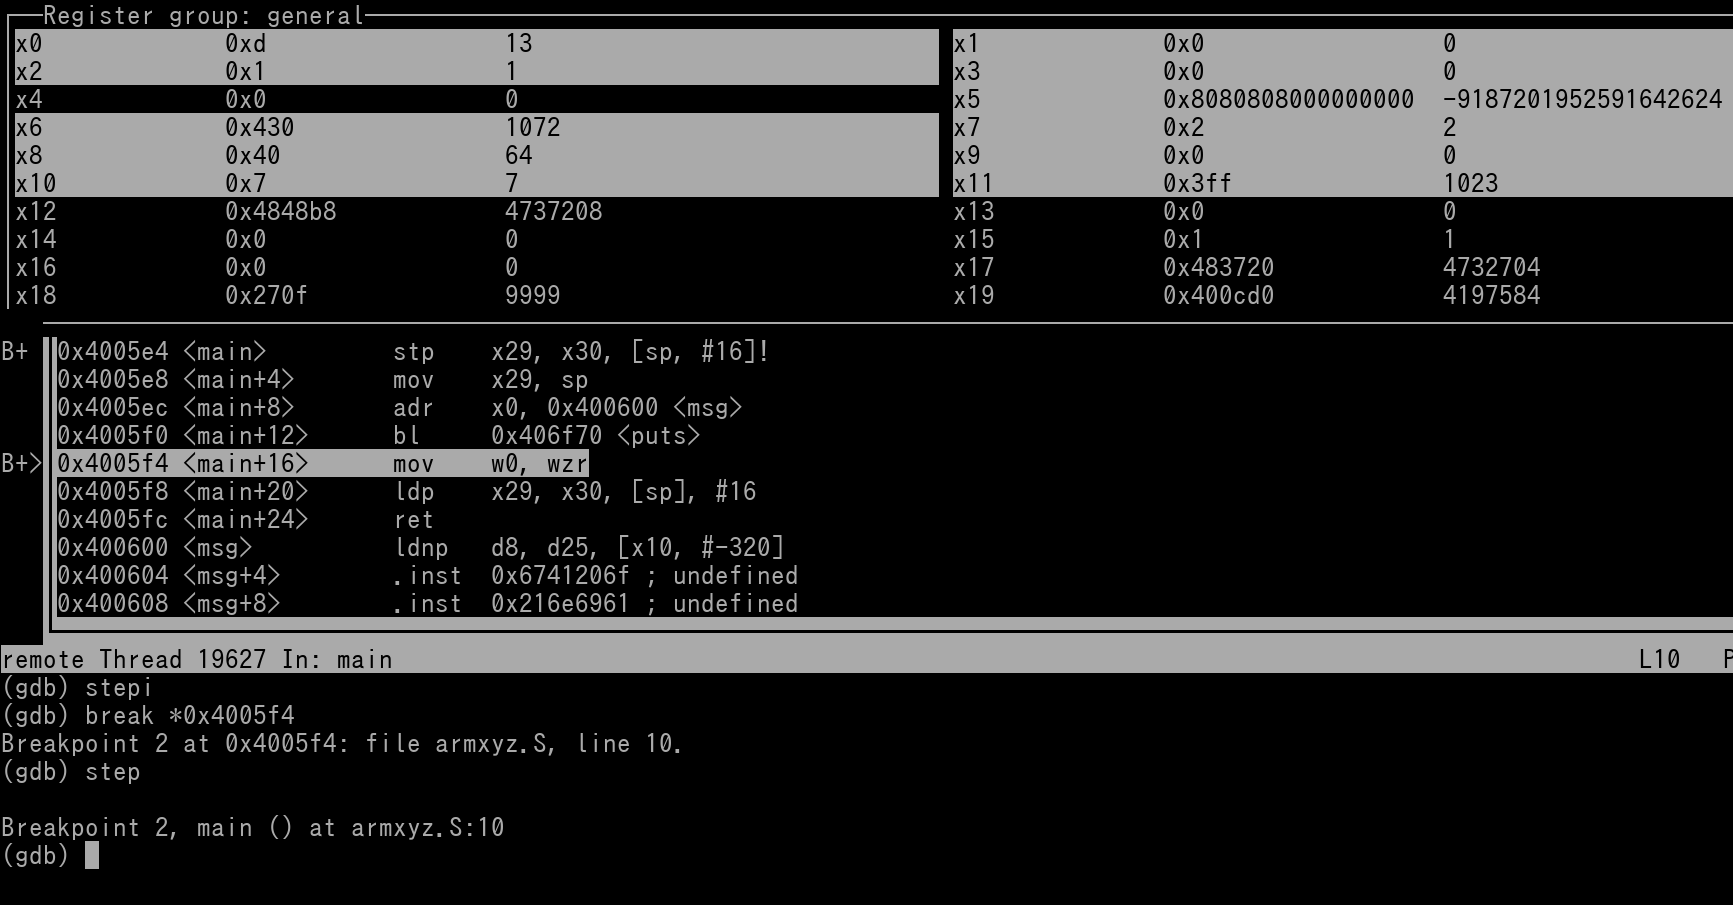
As you can see the breakpoint was hit and execution has been halted. Go take a look at the terminal you are using to run QEMU, you will see the String...
Alternatively, you do not need to set a breakpoint then issue a step to debug quickly through functions. You can instead use regular step (without the I) to step your ASM instructions one at a time. However, when you get to a function call, it will be stepped thru 100% for you in one go. This only works as long as the function is a native built-in C/C++ function. If it's a custom handwritten function, this method won't work. Also, sometimes GDB will let you step into the first instruction of the function itself, but as long as you issue regular step again, it will auto-step the rest of the function, and you will back at your original code again.
GDB Memory Commands
One thing we haven't covered with the GNU Debugger is how to look at Memory. GDB comes with the following Memory Command template...
x/nfu addr
If nfu all are set to default values (which would also be the case if they were all omitted), then the slash (/) is *NOT* needed in the memory command.
Example memory command showing 4 hex words at address 0x1234C
x/4xw 0x1234C
Instead of having to fill in an address, you can instead reference a register using the "$" symbol.
Example memory command showing 2 hex words located at the Stack Pointer (SP):
x/2xw $sp
***IMPORTANT NOTE, READ THIS!!!***:
Because of Little Endian shenanigans, if you want to see the true/unconverted contents of Memory, you must use the Byte unit type in the GDB Memory Command.
Let's revisit the two above examples. To show the 4 hex words at address 0x1234C, you must instead issue this command...
x/16xb 0x1234C
And to show the 2 hex words at SP, you must issue this command...
x/8xb $sp
Conclusion:
Alright, so that's it for this Chapter. You now have the basic knowledge to assemble your Source Files and test run them.